Circular Dichroism (CD) Spectroscopy
Circular Dichroism (CD) is observed when optically active matter absorbs left and right hand circular polarized light slightly differently. It is measured with a CD spectropolarimeter, which is relatively expensive (~$70k). The instrument needs to be able to measure accurately in the far UV at wavelengths down to 190-170 nm. In addition, the difference in left and right handed absorbance A(l)- A(r) is very small (usually in the range of 0.0001) corresponding to an ellipticity of a few 1/100th of a degree. The CD is a function of wavelength. CD spectra for distinct types of secondary structure present in peptides, proteins and nucleic acids are different. The analysis of CD spectra can therefore yield valuable information about secondary structure of biological macromolecules. See reference [1] for a review.
Linear polarized light can be viewed as a superposition of opposite circular polarized light of equal amplitude and phase. A projection of the combined amplitudes perpendicular to the propagation direction thus yields a line (figure 1a). When this light passes through an optically active sample with a different absorbance A for the two components, the amplitude of the stronger absorbed component will smaller than that of the less absorbed component. The consequence is that a projection of the resulting amplitude now yields an ellipse instead of the usual line (draw on a sheet of paper and check). Note that the polarization direction has not changed. The occurrence of ellipticity is called Circular Dichroism - it is not the same as optical rotation. Rotation of the polarization plane (or the axes of the dichroic ellipse) by a small angle a occurs when the phases for the 2 circular components become different, which requires a difference in the refractive index n. This effect is called circular birefringence. It can be shown that when CD exists, optical rotation must exist as well, and they are directly related by a Kronig-Kramers transformation (see anomalous x-ray dispersion (scattering factors f ' and f '') for more on K-K). The change of optical rotation with wavelength is called optical rotary dispersion, ORD. For more details on the physics see reference [3].
Figure 1 (a) Linear polarized light can be viewed as a superposition of opposite circular polarized light of equal amplitude and phase. (b): different absorption of the left- and right hand polarized component leads to ellipticity (CD) and optical rotation (OR). The actual effect is minute and using actual numbers the ellipse would still resemble a line.
The most common instruments around are the currently produced JASCO, click here for JASCO U.K. home page), Jobin Yvon, OLIS, and AVIV models, and the legendary, out-of-production Cary 60 (with the 6001 CD kit) or Cary 61. We have a Jasco 715 model with a temperature controller and sample changer for rapid denaturation studies. The air cooled 150W Xenon lamp does not necessitate water cooling, and the whole optics design and the piezo-mechanic modulator are a great advantage over the old, floor-space space hogging Cary with its Pockels-cells. You still need to purge with ample nitrogen to get to lower wavelengths (below 190 nm). Meet JASCOMAN.
Jasco 715 with Windows 95 data acquisition and processing
computer. The annoying character
blocking the view is graduate student Chris Barry.
Most of the Carys are upgraded in some way. We had a great running computerized Cary 60/6001 that is now donated to the UC Davis student instrumentation lab, but somehow I think they really hate me for that.
Out-of-production Cary-60/61 CD spectropolarimeter (1965) with data acquisition computer
Sample preparation and measurement
Additives, buffers and stabilizing compounds: Any compound which absorbs in the region of interest (250 - 190 nm) should be avoided. A buffer or detergent or other chemical should not be used unless it can be shown that the compound in question will not mask the protein signal. For instance imidazole cannot be used below 220 nm because it overwhelms the spectrum from then on. Therefore ensure that only the minimum concentration of additives are present in the protein solution.
Protein solution: From the above follows that the protein solution should contain only those chemicals necessary to maintain protein stability, and at the lowest concentrations possible. Avoid any chemical that is unnecessary for protein stability/solubility. The protein itself should be as pure as possible, any additional protein or peptide will contribute to the CD signal.
Contaminants: Unfolded protein, peptides, particulate matter (scattering particles), anything that adds significant noise (or artifical signal contributions) to the CD spectrum must be avoided. Filtering of the solutions (0.02 um syringe filters) may improve signal to noise ratio.
Data collection: Initial experiments are useful to establish the best conditions for the "real" experiment. Cells of 0.5 mm path length offer a good starting point.
Typical Initial Concentrations:
Protein Concentration: 0.5 mg/ml
Cell Path Length: 0.5 mm
Stabilizers (Metal ions, etc.): minimum
Buffer Concentration : 5 mM or as low as possible while maintaining protein
stability
One may find that the protein concentration needs to be adjusted to produce the best data. Changing this has a profound effect on the data, so small increments or decrements are called for. If that does not produce reasonably good data, a change in buffer composition may be necessary. It would also be a good idea to check the sample for unforeseen aggregation via Dynamic Light Scattering (DNA repair enzymes are an especially good example of this behavior). If absorption poses a problem, cells with shorter path (0.1 mm) and a correspondingly increased protein concentration and longer scan time can help.
As mentioned in the introduction, the difference in absorption to be measured is very small. The differential absorption is usually a few 1/100ths to a few 1/10th of a percent, but it can be determined quite accurately. The raw data plotted on the chart recorder represent the ellipticity of the sample in radians
![]() which can be easily converted into degrees
which can be easily converted into degrees
![]()
To be able to compare these ellipticity values we need to convert into a normalized value. The unit most commonly used in protein and peptide work is the mean molar ellipticity per residue. We need to consider path length l, concentration c , molecular weight M and number of residues
![]() in proper units (CD spectroscopists use decimol)
in proper units (CD spectroscopists use decimol)
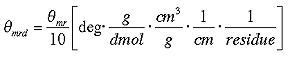 which finally reduces to
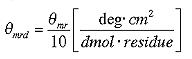
The values for mean molar ellipticity per residue are usually in the 10.000's
Fitting of CD spectra
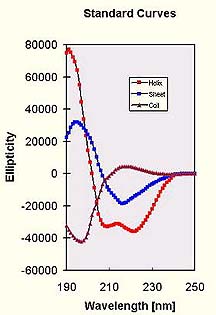
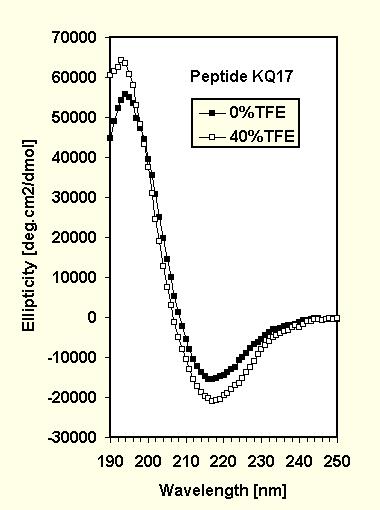
After baseline subtraction we are ready to analyze the data. As we mentioned already, each of the three basic secondary structures of a polypeptide chain (helix, sheet, coil) show a characteristic CD spectrum. A protein consisting of these elements should therefore display a spectrum that can be deconvoluted into the tree individual contributions. This has been realized quite early after CD was introduced and the standard curves shown to the right were published in 1969 by Greenfield and Fasman [2]. Although those are actually for poly-lysine only in different conformations, only little improvement in the accuracy of fits has been achieved by attempting to generate other standard data sets from protein spectra of known structure [5]. There are many limitations inherent in the method (such as the lack of consideration of chromophore interaction between different structural regions and neglect of other elements, 3-10 helices etc.), and the accuracy is not very high. I personally think that a fit with an R-value below 10% is actually quite acceptable and what one would expect for a qualitative assessment of protein folding. The method is, however, very reliable for monitoring changes in the conformation of proteins under different conditions (denaturation studies, unfolding experiments etc, helix induction by TFE [4], see poly-glutamine example). Certain backbone conformations can reveal quite different spectra - click highlight for an example of an extended sheet of poly-Q.
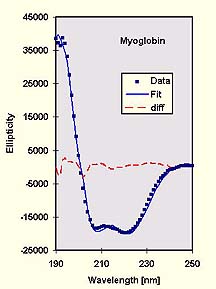
Actual fit of a sample data against the Fasman poly-lys standards (left) using my program CDFIT. The R-value of the fit is 6%, with a total helix content of 80% and 20% random coil. The actual value is 77% total helix content. Note that the results can be different depending on the region of fit [1] - a clear indication that such fits must be treated with care.
 -----------------------------------------------
 CD DATA fitted by CD-FIT program (B.Rupp, 1996)
 -----------------------------------------------
 CD raw data file        : swmb.knp
 CD baseline file        : swmb.bas
 Sample header file      : swmb_header.txt
 Ellipticity output file : swmb.CDF
 Results file            : swmb.RES
 Standard data file      : lys.dat

 61 data points from 190 to 250 nm
 --------------------------------------------
 Molecular weight       g/mol   :    17600.00
 Sample concentration  mg/cm3   :     .500000
 Cell path             cm       :     .050000
 Number of residues             :  153.000000
 Conversion factor [cm2/dmole]  : 70399990.00
 --------------------------------------------
      Rfac  %  helix     sheet      coil
      6.13     80.56       .00     19.44
 --------------------------------------------
![]() Least
Squares Fitting Method
Least
Squares Fitting Method
![]() Implementation
Implementation
![]() Get the program
(CDFIT) or JFIT for Jasco data
Get the program
(CDFIT) or JFIT for Jasco data
![]() Subtilisin
Subtilisin
![]() Poly-Glutamine Repeats
Poly-Glutamine Repeats
Circular dichroism spectroscopy is used to gain information about the
secondary structure of proteins and polypeptides in solution.
Benefits : Uses very little sample (200ul of 0.5 mg/ml solution in
standard cells), non-destructive. Relative changes due to influence of environment on
sample (pH, denaturants, temperature etc.) can be monitored very accurately.
Drawbacks : interference with solvent absorption in the UV region, only
very dilute, non-absorbing buffers allow measurements below 200 nm. Absolute measurements
subject to a number of experimental errors, average accuracy of fits about +/- 10%. A CD
spectropolarimeter is relatively expensive.
![]() Back to X-ray Facility Introduction
Back to X-ray Facility Introduction
LLNL Disclaimer
This World Wide Web site conceived and maintained by
Bernhard Rupp (br@llnl.gov)
Last revised May 13, 2005 21:57
UCRL-MI-125269