Using Fundamental Parameters to Check for degradation phases during Rietveld Analysis
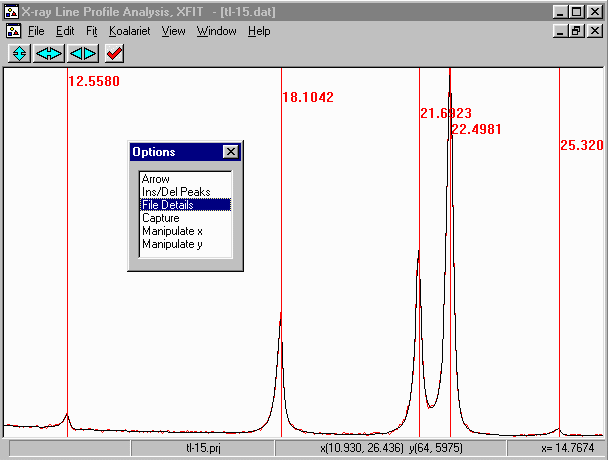
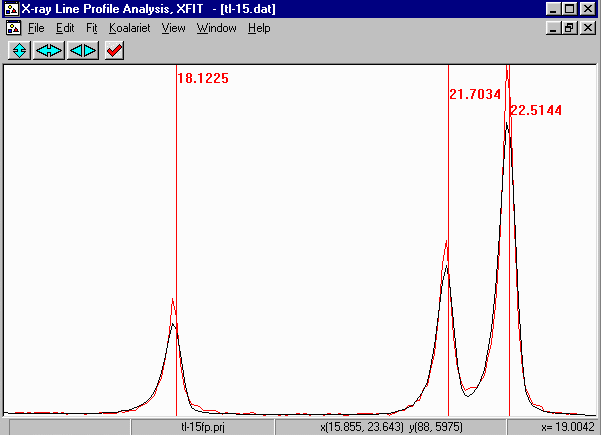
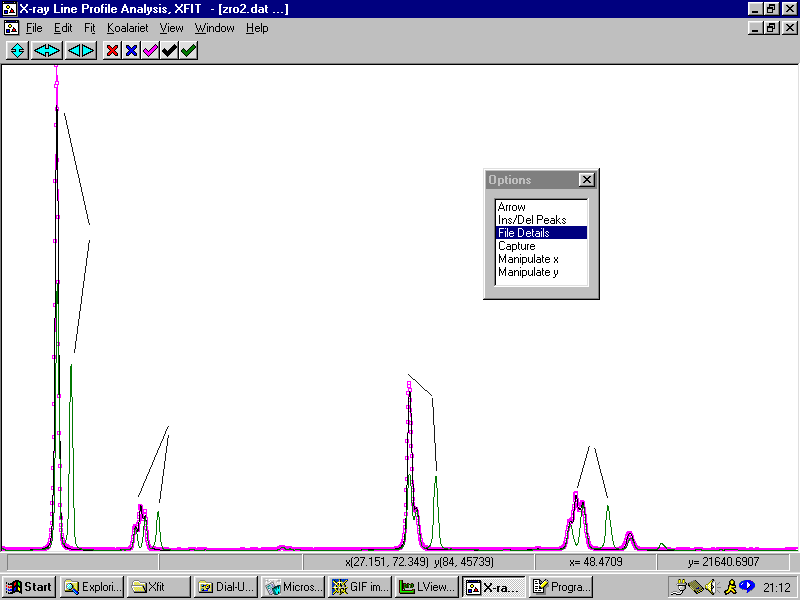
While Empirical fitting does a nice job covering a lot of this up, misfits here imply the phase is degrading, and helps the user be more confident about peak assignments and possibly estimate if something strange might be going on with the sample (assuming the diffractometer alignment has been checked - this might also be showing if the diffractometer is out of alignment)
Empirical Pearson VII fitting Fundamental Parameters


Thus possible something is going on, more exploration reveals the phase is degrading over time.
Checking Diffractometer Settings/Alignment with a Fundamental Parameters (FP) Rietveld
The text in the above example is a bit small but in the following, note that Koalariet (Fundamental Parameters Rietveld) is validating the slit settings and alignment of the Philips 1710 used to collect this data. The receiving slit (0.2mm) and diffracted beam Sollers slit (5.1 degrees) (These are the two pieces that are routinely inserted and removed depending on the type of data collection) refines to near the expected values. Note that the Sollers slits can give variable results depending on how carefully they are inserted into position.
This can also be done in XFIT (the other half of Koalariet) peak profiling software.
CUKA5
LP_FACTOR(!lpfactor, 17)
xdd_diffractometer_radius 173
xdd_length_of_tube_filament 12
xdd_sample_length 15
xdd_receiving_slit_length 12
xdd_receiving_slit_width @ 0.1991
xdd_primary_soller_angle 5
xdd_secondary_soller_angle @ 4.492
xdd_divergence_fixed_angle 1
CS(cs1, 3142.33512) 'Crystallite Size
MS(ms2, 0.00010) 'Microstrain
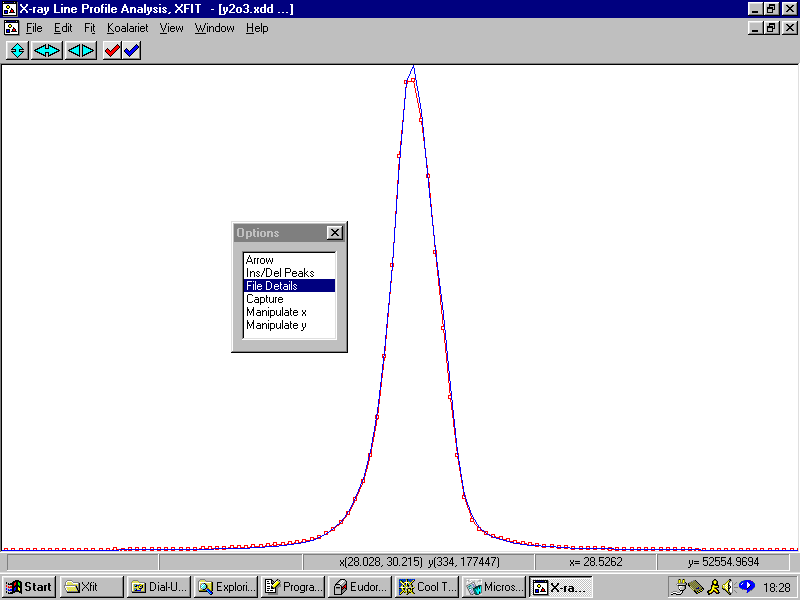
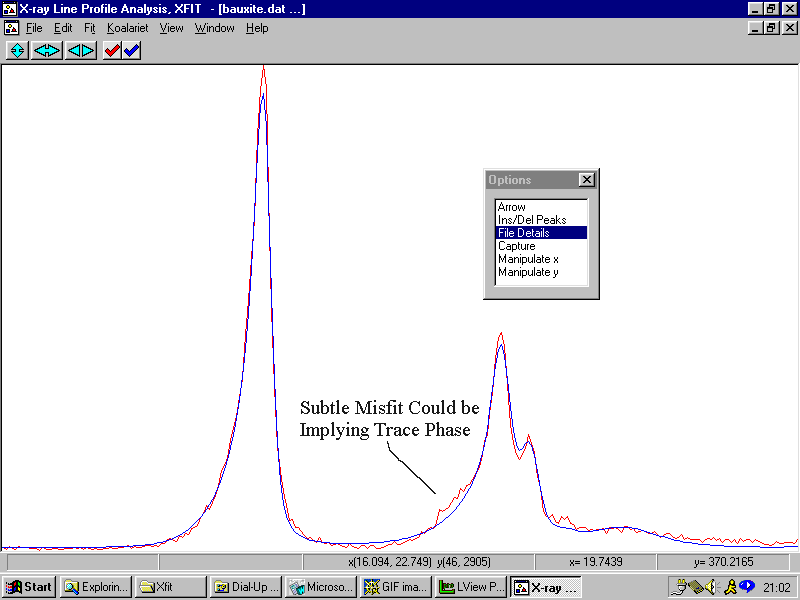
Is This Really a Trace Phase Peak or just residual? - Bauxite Sample. Trying to use FP Rietveld or Peak Profiling to help identify trace phases from the difference plot.
Rather Sweeping Brush here and a non-rigorous demo.
(and non-comparitive). Point being that any misfit must be due to some ignorance about the sample or the diffractometer - at 19.8° 2-theta.
In the Rietveld: anatase, gibbsite, hematite, quartz, Kaolinite,
CUKA2
xdd_diffractometer_radius 173
xdd_divergence_fixed_angle 1.0
' xdd_linear_absorption_coefficient 60.0
xdd_receiving_slit_width 0.3
xdd_length_of_tube_filament 11.0
xdd_sample_length 15.0
xdd_receiving_slit_length 11.0
xdd_primary_soller_angle 5.1
xdd_secondary_soller_angle 9.1
LP_FACTOR(!th2_mono, 17)
STR(F_M_-3_M) ' Cubic Zirconia
CUBIC(p04a 5.00000)
CMPR or Unit-Cell Refinement to get a better starting value for Rietveld/Structure/Quant Analysis
If the "starting" value of the unit-cell is too far off, might have very little chance for the Rietveld to lock on. Far more reliable to do a UNIT Cell refinement. While doing this the first time can be tedious, but faster when second time around when you have the templates. Better still to have software where you can point and click at peaks which will then give an immediate result. Brian Toby's CMPR is good software to try here. 15 to 60 seconds from start to finish, you have a good starting value for the UNIT-Cell.
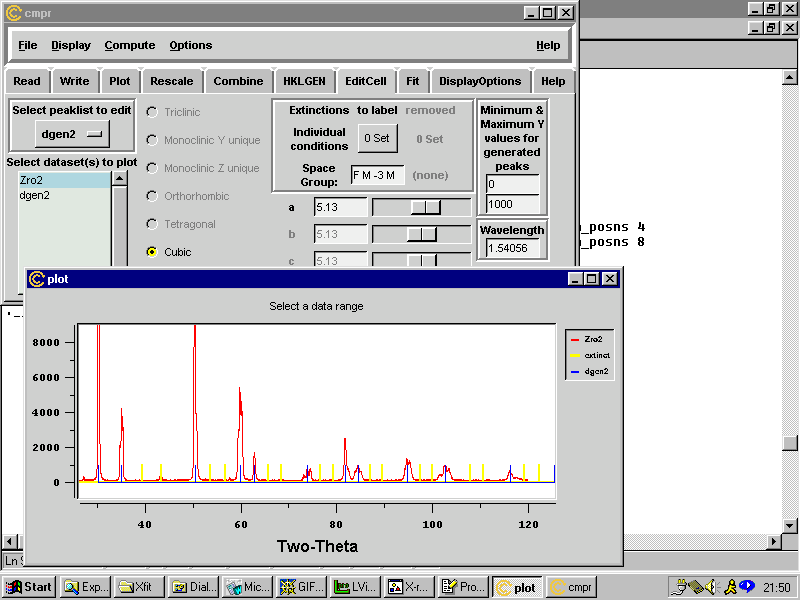
CMPR gives rough unit-cell of 5.13Å, Rietveld gives 5.13657Å
"
Accurate" UNIT-Cell refinement
Note that for "accurate" unit-cell refinement, best to use proper unit cell refinement software (Xlat, Xpowder, Unitcell, Refcel, etc) using an appropriate "certified" internal standard (usually NBS/NIST Silicon). Though given lack of available NBS/NIST 640(a,b) Si, Deane K. Smith Silicon or other powder is used to do the job.
Note that while Unit-Cell refinement software will give an accurate result, usually best to let the Rietveld software refine the unit cell (even if away from its true value) to get the best fit of the intensities which both structure solution and quantitative analysis rely on.
Defining the Width of a Trace Phase
Using a peak profiling program, use empirical peak fitting, use a Pseudo-voight peak to get the FWHM and Shape (L1/Shape 1) for inputting into the Rietveld.
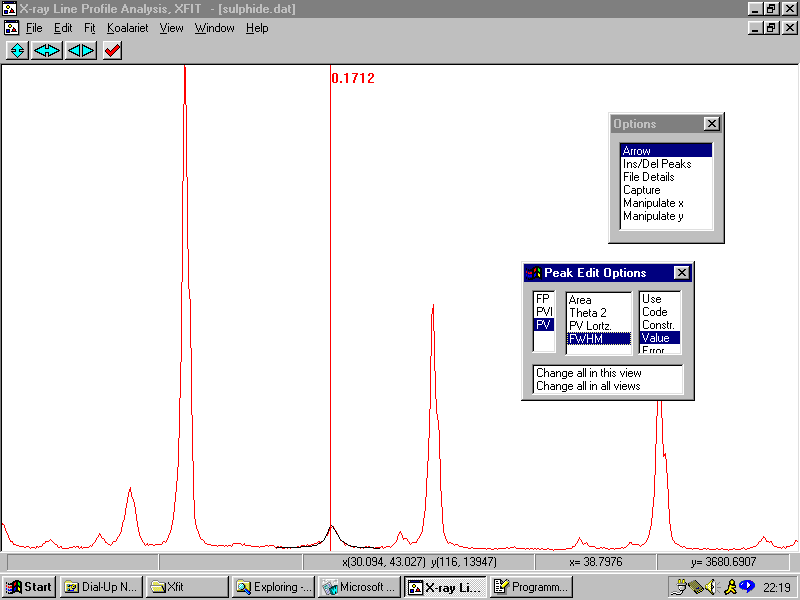
This implies a FWHM of 0.1712 and shape (100% Gaussian in this case) to be plugged into the relevant part of the Rietveld software equations.
Given Some Expect Rietveld to be a 5 second Solution - A Summary of Sorts
Lot of good Rietvelds/software around. Tend to match the software to the problem (hardware is often invariant).
To consistently obtain quality results with quantitative Rietveld; still requires time, thought, expertise, tendor loving care, etc. Not really a mature technique in the same way that XRF, wet-chemical methods, etc might be considered "mature" (i.e., scientific equivalent of some black magic still involved and some sort of validation is still a must).
Is a tradition to only give the "good" results in publications and at conferences (would be nice to have a "Journal of Scientific Non Starters"). If people do not elaborate on where Rietveld/Quant analysis is failing; do not expect any improvements or fixes to occur (or to occur very slowly).
Rietveld software and Quantitative Phase Analysis is still an area open to much research and development.
Accuracy
Functionality
Useability/Intuitiveness
Algorithms, stability
Expert systems.
Would be nice to see quantitative analysis to maturing the point where it is equivalent to that (or the myth) of XRF (i.e., after optimisation, people can crank the wheel and expect an accurate result)
Closer integration with other analytical techniques, XRF, Wet-chemical, etc.
Mass Analysis of Data (XRDs now collecting at 1 to 90 seconds per scan - or less than a second) implies/infers improved algorithms and expert systems. Thus some practical analysis systems of the future will have to be "black boxes" of some sort to be practical. If you think this is dodgy, customers will most likely be going to people who are working to achieve this.
Refer: DOE Grand Challenge Data Access Project for HENP (High-Energy and Nuclear Physics)
http://www-rnc.lbl.gov/GC/
(DOE Projects of this kind give the impression they don't value just extending old technology)
Labouring the Point - the Importance of Software - High Quality Mass Analysis of Data Refer Also: CSIRO Division of Minerals - Chimage software for analysing Microprobe maps by Nick Wilson.
Daresbury Laboratory, Beamline 16.4 - Energy Dispersive X-ray Diffraction system with 3 detectors. Collecting data every 5 to 90 seconds for many types of experiment. (e.g., every 60 seconds, 3 datasets, for a week of beam time = ~90,000 datasets.
Old system: "Genie" program on Micro Vax - analysing one peak at a time. For users, literally months (4 months to two years) of drudgery to do "peak fitting".
Putting a "kludge system" together consisting of a:
(if following seems rather purile/amateurish - synchrotrons are about building hardware - software to actually analyse the data is often considered a "user" problem)
Mass Dataconversion "jiffy" program
(DL Convert by Matt Smith, now Sebastien Gontier)
XFIT (Coelho and Cheary) - with optimised config file to take in up to 150 files at a time, and extra little kludges it was not really made for.
XFIT has no limit on the number of peaks that can be entered for fitting
PRJ "jiffy" program by Andrew Jupe of Berbeck College which can quickly duplicate XFIT "template" files.
A shareware/freeware Keyboard/Macro player for Windows (Macro Scheduler).
Is now possible for 16.4 users to keep up with the data with respect to peak profiling. (though no available link to unit cell refinement or kinetics software) - bottleneck has moved up to a new point.
Visual feedback still available - though is still an intense effort - but not compared to what was required previously. Also on a PC system that users have at their home labs.
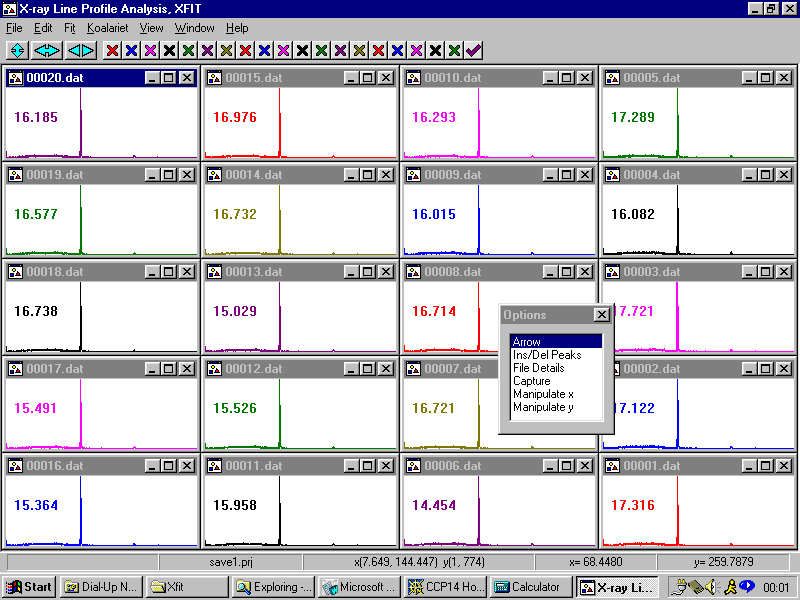
If this is what a "kludge" system can do; extrapolate to a "custom" mass analysis of data system.