Hints on Phase Identification Using Powder X-ray Diffraction
(Supporting an Oral Presentation)
Lachlan M. D. Cranswick
(E-mail: lachlan@melbpc.org.au (old E-mail but still functional))
CCP14, Daresbury Laboratory, UK - E-mail: L.Cranswick@dl.ac.uk
(http://www.ccp14.ac.uk)
Nabalco Refinery, Gove, Northern Territory, May 1997 (Version 1)
RMIT, Melbourne, Australia, 1997 (Version 2)
Melbourne University, Melbourne, December 1997 (Version 3)
CSIRO Minerals/AXAA Western Australian Branch Combined Meeting, Perth, Australia, March 1999, (Version 4)
On the web at http://www.ccp14.ac.ak, March 1999 (Version 5)
March 1999, Version 5
(Please inform the author of any mistakes, mis-interpretations, errors, goofs, etc presently in the text)
© Lachlan Cranswick 1996-1999. May be freely modified and distributed for non-commercial and commercial use providing sources are acknowledged. Much of the following are opinions of Lachlan M. D. Cranswick as of March 1999.
Index
Aims/Agenda
Search-Match Software Results
Examples
Example 1: Single Phase Unknown - Calcium Fluoride
Example 2: Unknown - Zircon - and trace peaks to be assigned
Caution Will Robinson: the common phase might not be the real phase. Franklinite/Magnetite as an example
Example 2a: Identifying the trace phase and sample prep peaks
Example 2b: Identifying spurious peaks
Rantlett relating to the above Franklinite/Magnetite example
Example 2c: Showing a phase is not present
Example 3: Amorphous hump, preferred orientation, low background plates.
Example 4: Non-optimal ICDD data example - Plattnerite
Example 4a: Non-optimal ICDD data - bad data replacing good
Example 4b: Non-optimal ICDD data example - Magnetite
Calculating powder patterns using Rietveld Software
User-friendly calculation of powder patterns using Powder Cell for Windows
Example 5: Geothermal Vent sample - normally exotic phases
Example 5a: Qualitative XRF to confirm and help ID trace phases
Example 6: Non-trivial sulphide ore sample - tricks to Identify - and - the Microprobe can see more complexity than the XRD.
Example 7: Ilmenite System - the benefits of 20 years of experience
Example 8: Microdiffraction on tiny samples using a Gandolfi camera.
Example 9: Bauxite system - benefits of interacting with the people who generated the sample.
Example 9a: Bauxite system - identifying "some" of the trace phases.
Example 10: Contrived example of using quantitative Rietveld to help identify obscured trace peaks.
Example 11: Example 9 Bauxite system - further example of "accidental" interacting with experts to help solve "unassigned" trace peaks.
Example 11a: Using internet based resources (in this case the Clay Minerals Mailing List) to gain opinions, discussion and assistance.
The benefits of experience or interacting with experienced people.
Available Search-Match software (as of March 1999)
Book References on Phase Identification using Powder X-ray Diffraction.
Summary
Aims/Agenda
Give an indication of what Phase Identification of Unknown Systems can be like.
Try and show that when it comes to the crunch, experience and intuition in Phase Identification is what counts. You cannot just rely on computers and software programs.
How to attempt to identify trace phases.
Recognising spurious peaks. E.g.;
CuKBeta
Tungsten
Spikes
etc
How to report results. The main aim is to transfer across to the report reader the degree of reliability and the degree of uncertainty.
When not 100% sure of results (which can be a standard occurance with many types of phase systems), making use the full range of ambiguity the English language allows you is everything!
Are you sure the identified phases can exist in this sample?
(i.e., Identifying Pb2O3?- This is a high pressure phase)
This is where the PDF-2 Database can be very handy.
Learn to use words like, maybe, possible, likely, is expected, looks like, etc, etc. This is especially so with trace phases.
It is easier to do this after doing a lot of Phase ID as your experience gives you a guide on what Phase ID is like. Otherwise, you have to believe other people.
Many Phase ID courses use contrived samples that have a known solution. In the real world, you do not know that there is a solvable answer (with the available equipment, software and databases) in advance.
Search Match Results
All search match results give are a list of suggestions. It is up to the person running the software to try and pick the correct suggestions or recognise that there are no reasonable The software does not care if you pick the wrong results.
Better algorithms and better data gives better search-match suggestions.
If a sample refuses to be easily solved, what can you do?
Look under an optical microscope to try and visually identify the different phases, or acertain from different colours how many phases might exist in the sample.
Only do a search on the major peaks.
Only do a search on like peaks (i.e., broad, sharp)
Use a different search match program
Use a Hanawalt search
Use a Fink Search
Use a PDF-2 CD-ROM 2 to 3 peak search.
Limit the search on chemistry.
Limit the search based on prior experience
i.e., common minerals,
Contact people experienced in this phase system to see if they have suggestions.
Do a literature search.
Have a cup of tea and think about it.
Gunshot Peak Search
Use XRF to give elemental analysis
Use SEM to identify chemistry of individual particles.
Try and separate the components if multiphase.
In the case of minor phases, try and rig the experimental or process conditions to change the ratio of phases.
Does it really matter if some of the phases are unknown?
Could these be phases not categorised before?
Could there be related phases giving similar series of peaks
Magnesium Hydroxide Nitrate - not in the literature or database
Nickel Hydroxide Nitrate is and gives near identical peak positions.
The two phases are Isostructural!
(Good to have crystallographic experience or knowledge with this example)
If not confidential, post the data out on the internet/Usenet newsgroup, sci.techniques.xtallography as a challenge for people.
Example 1
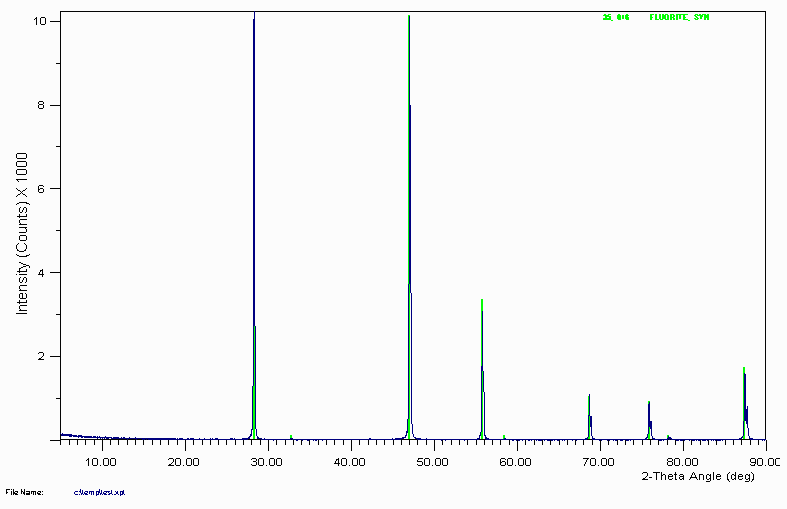
Search Match gives a number of suggestions of which the best visual fit is Fluorite (Calcium Fluoride - CaF
2)

The degree of confidence if which this assignment can be made depends on:
Experience of operator
Goodness of the Visual Fit (do not take Figure of Merit values that seriously)
Prior knowledge on sample (complete unknown?)
Confidence in search-match software used.
Always pays to never be 100% certain based only on XRD. If complete unknown, it would not hurt to get a qualitative XRF or other analysis to confirm the chemistry. Small test-tube experiments could also be used.
Even if supplier of the sample claims to know the chemistry, don't put 100% credence on this. Is quite possible that the sample stated as containing Aluminium actually contains magnesium instead.
It never hurts to get more information on the sample.
Many laboratories get into a routine phase identification scan routine. For a diffractometer with a Copper X-ray tube, 5 to 65° can be quite common. Though it should be noted that peaks below 5° will obviously be missed. If the sample is a small unit cell material such as simple oxide or metal, only 2 to three peaks may be visible for the phase which may not be enough for the search-match software. Collecting up to 90° may be a good move. Thus show care depending on the types of sample you might be encountering.
Example 2
Search Match on this unknown gives an excellent visual fit with Zircon (Zirconium Silicate - ZrSiO
4)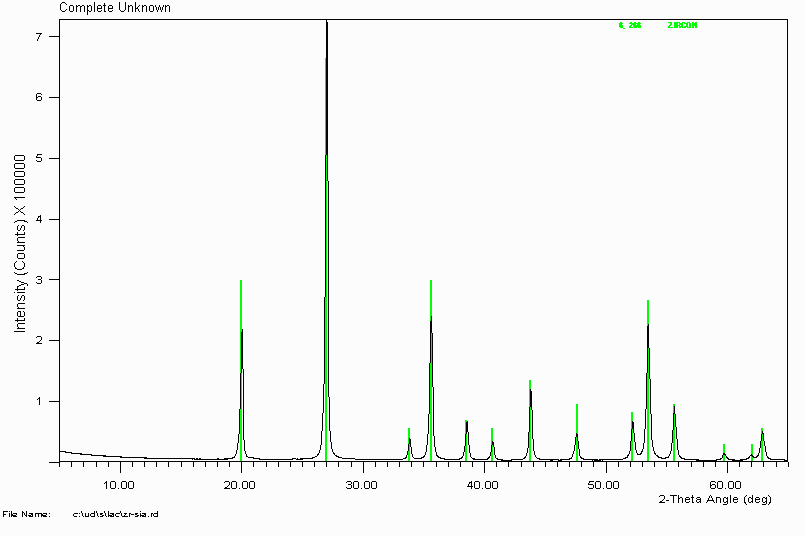
In this case, I didn't bother getting an elemental analysis. Over time, many common minerals tend to be the solution to phase ID problems. This is probably why they are called common minerals(?)
Caution Will Robinson!
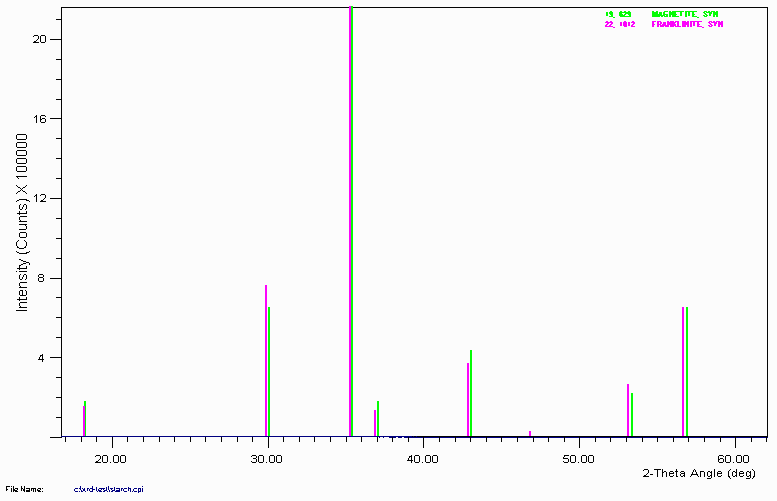
Be wary though that some common minerals can have similar patterns to rarer minerals. The assignment of the rarer mineral can actually be the correct solution. An example of this is magnetite (iron oxide) and franklinite (iron zinc oxide). In this case, a sample (labelled iron oxide) of franklinite was matched as magnetite. Fortunately the presence of minor zincite (zinc oxide) lead to a re-examination of the magnetite assignment, combined with using a silicon internal standard to obtain absolute peak positions. Luck more than skill! Also, common minerals such as iron oxides/hydroxides or aluminium oxides/hydroxides can be substituted with other elements that can cause significant peak shifts.
Spinels are something that you should definitely put in the SEM (Scanning Electron Microscope) for confident chemistry as many spinels have varied elemental composition but very similar XRD patterns. Analysing samples such as spinels by XRD can be rather frustrating. An SEM is a major help in these cases as well as others where XRD gives ambiguous results.
Example 2a
That's the finish of this sample then? NO! You should always closely examine the data for trace peaks. In this case, several trace peaks are apparent.
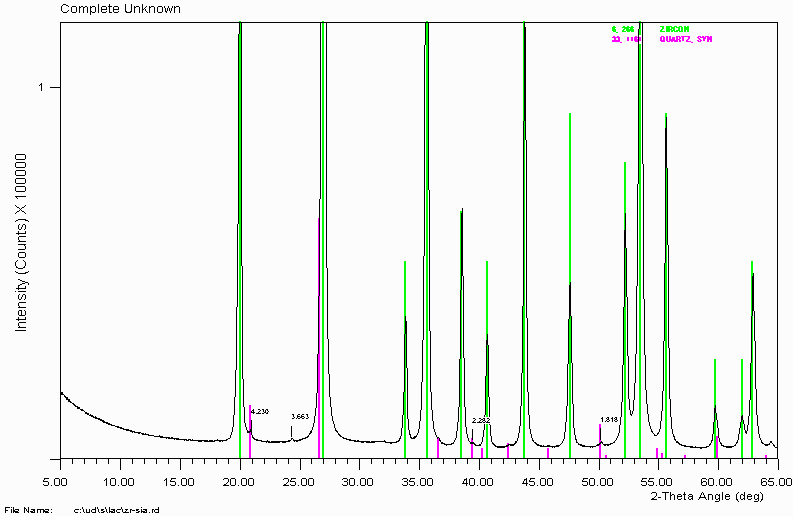
Use of search-match and the ICDD/JCPDS PDF-2 database reveals quartz is present. Many people use quartz to clean out mortar and pestles. When doing this, make sure the mortar and pestle is clean as this could contaminate the next sample with low levels of quartz. In this case, quartz is really in the sample.
More on phases with peak shifts. Quartz is a very nice position standard as it is usually of very constant composition and the peaks are very well defined. If you determine quartz in your sample, you can normally do a 2-theta calibration on the quartz.
Peaks shifts can occur for several reasons.
Poorly aligned diffractometer.
Poor/sloppy sample packing.
Phase could be substituted or a completely different phase
When in doubt, add an internal silicon internal standard (or other if silicon is part of the sample) and calibrate on silicon. Also, if there is a significant 2-theta shift in the silicon peaks, check your sample packing techniques. If there are still serious peak shifts, check the alignment of the diffractometer.
Example 2b
There is still a single peak remaining. If you try, you can probably match this with a phase and it will probably make sense. However!: this peak is actually a satellite of the major Zircon peak caused by Cu K Beta radiation of wavelength 1.39217Å. Copper K Alpha (1&2)is 1.5418Å
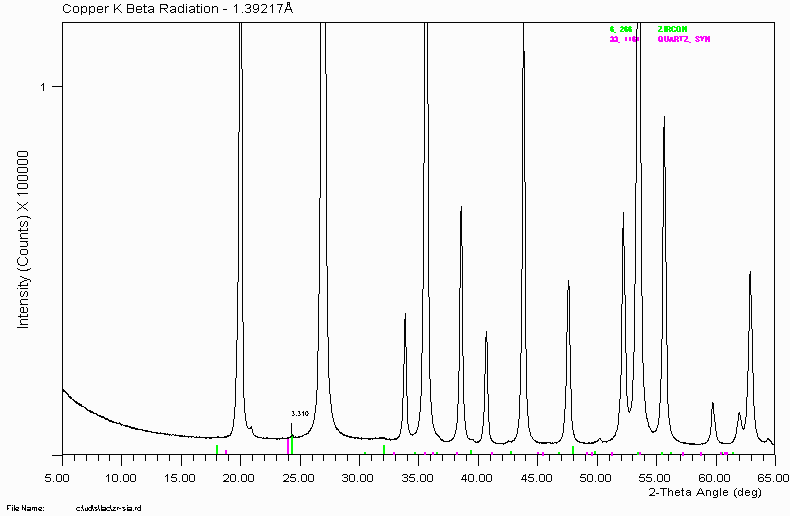
Philips 1050 based XRD systems with diffracted beam curved graphite monochromators (the main system I have used) can let through two main types of contaminating radiation for Copper (Cu) X-ray tubes.
Copper K Beta radiation of 1.39217Å
In ageing XRD tubes (and some new!) Tungsten radiation of 1.476Å
This has the implication of causing two trace peaks for every major peak at lower angles.
A third main type of spurious peak is actually caused by the ICDD/JCPDS database. The quality of the database is quite variable and some phases including a few common mineral oxides do not have minor peaks included. So a trace peak, sometimes quite significant in the pattern, could be the residual of dodgy reference data.
When complacent (and even if quite studious), it is not too difficult to get caught out and mis-assign a phase.
Be wary that other spurious peaks can exist depending on the hardware and settings. (e.g., higher order lambda effects due to scintillation counter settings; mis-set Automatic Divergence Slit or slit systems)
Minor Rantlett Relating to the above stated Magnetite/Franklinite Problem

Knowledge of physical properties can possibly help. In the case of the magnetite/franklinite problem, I was asked in one talk why didn't I use a magnet to distinguish between them. Not appreciating the individual physical properties at the time is one answer. Also, I was trained to use $300,000 XRD's to solve problems, not $2 magnets. When you have the expensive toy, you tend to try and solve everything with it, even if not appropriate.
For instance, if you have an extraction problem with your ore, an optical microscope could be far more useful in trying to explain why. A normal powder XRD may tell you what phases are present, but it will not tell you the spacial relationships (intergrowths) that often determine whether phases will easily segregate out in the processing plant. Before doing an analysis, try and define what is your aim and thus what is the most appropriate method to use.
Example 2c
Look! - no Witherite (Barium Carbonate - BaCO3) is present in this sample.
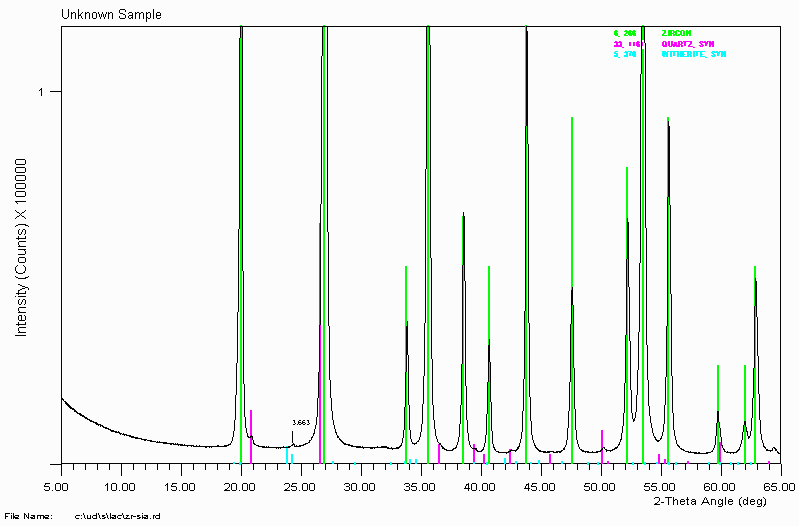
Phase Identification using XRD may be a bit tricky in unambiguously identifying certain phases as being present. However, it is very good at showing that a phase is absent. Please note that XRD is only sensitive to crystalline phases. While this shows there is no crystalline Witherite/Barium Carbonate present, there could still be amorphous Barium Carbonate present.
Example 3
This hump in the data implies the presence of amorphous or very poorly crystalline phases. In theory, pure amorphous material would give no hump at all and would not reveal its presence easily by XRD; except perhaps by helping to raise the background level.
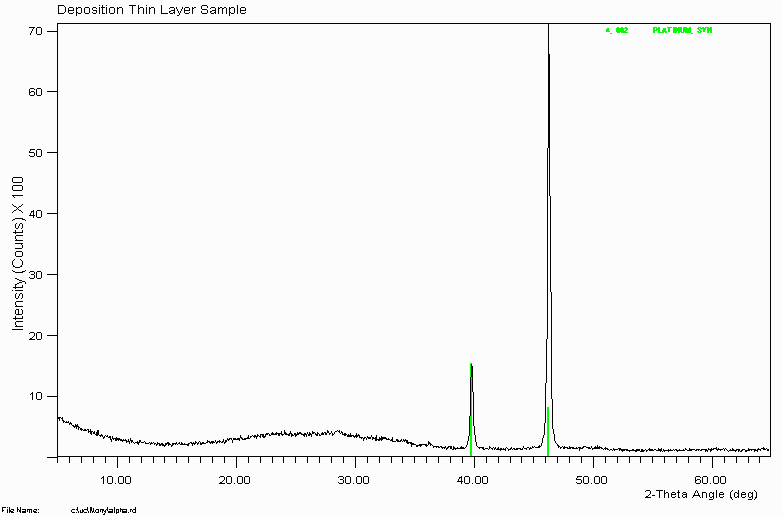
Note how the intensities of the Platinum metal do not match. This is due to very severe preferred orientation -often called texture when very severe. This is actually typical of running solid blocks of metal alloy in the XRD.
This is also why it is better to use a Silicon zero background plate rather than a glass plate on very small amounts of sample. If you use a glass plate, it can be more difficult to tell if the hump is purely due to the amorphous glass or whether the sample is also making a contribution due to amorphous material.
Example 4
"Non-optimal" ICDD/JCPDS reference data fails to correctly assign all the peaks. The minor peak at 2.436Å really belongs to Plattnerite (Lead Dioxide). Trying to correctly assign this 2.436Å peak to a "trace phase" could put you in a world of pain.
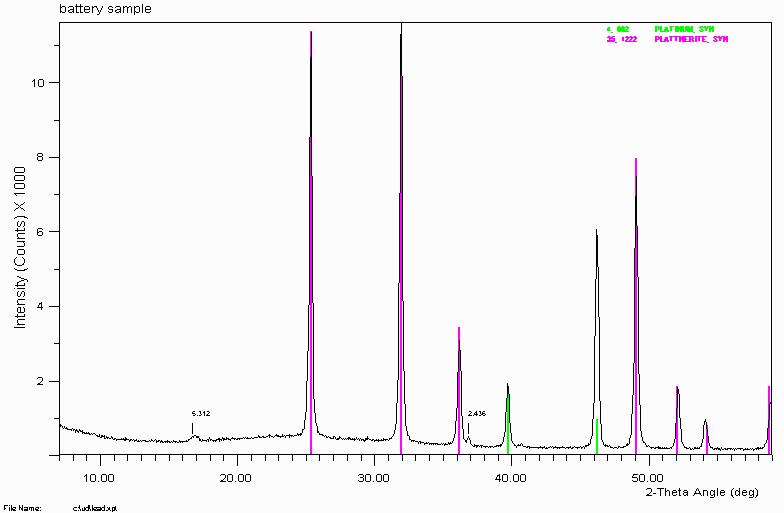
Moral is do not entirely trust the reference data you are given. One ceramic scientist I have known would only use XRD reference data of phases he had personally synthesised. He would only trust his own work - not other peoples.
If not mentioned before, peaks are normally labelled in D-spacing (Angstroms), not two theta (as D-spacing is independent of the wavelength being used). Not everyone uses Copper X-ray tubes. A significant portion use Cobalt X-ray tubes. Cobalt X-ray tubes can be better in some circumstances, such as the presence of Fe and non-Fe containing phases while trying to do quantitative Rietveld analysis.
Example 4a
The ICDD/JCPDS does update its data with better reference data over time. However, there are examples where they have replaced "good" reference data with "not as good" data. This set 25 Plattnerite reference pattern actually matches all the peaks quite well compared to the "later" set 35 plattnerite reference pattern. It is very useful to purchase the ICDD/JCPDS yearly updates of their PDF database but still be careful.
Often, the trace peaks are not included due to the ICDD reference pattern being collected on an old machine, or the product of a quick scan that could only locate the major peaks. The date and type of machine or instrument the ICDD reference data was collected on may given an indication of the quality of the reference data. On the whole, "diffractometer" is good (providing good counting statistics were achieved); whereas an old film based Diffraction system may miss trace peaks.
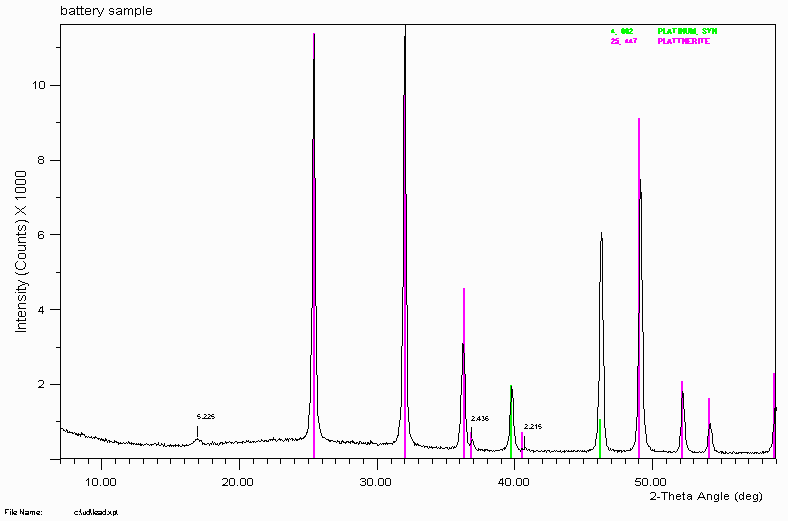
The older Plattnerite pattern also matches a very minor peak/hump at 2.215Å. Some ICDD/JCPDS patterns are deleted and replace with more modern data for a variety of reasons. It could be that some of the minor peaks did not actually belong to the stated phase.
Example 4b
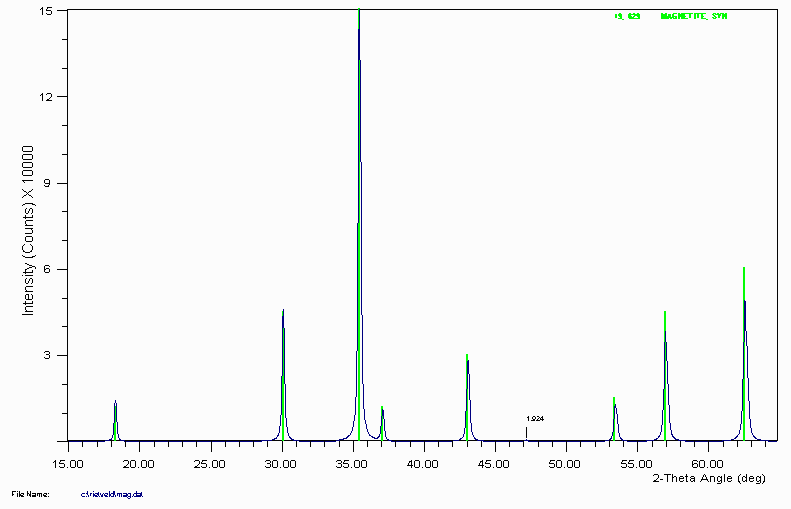
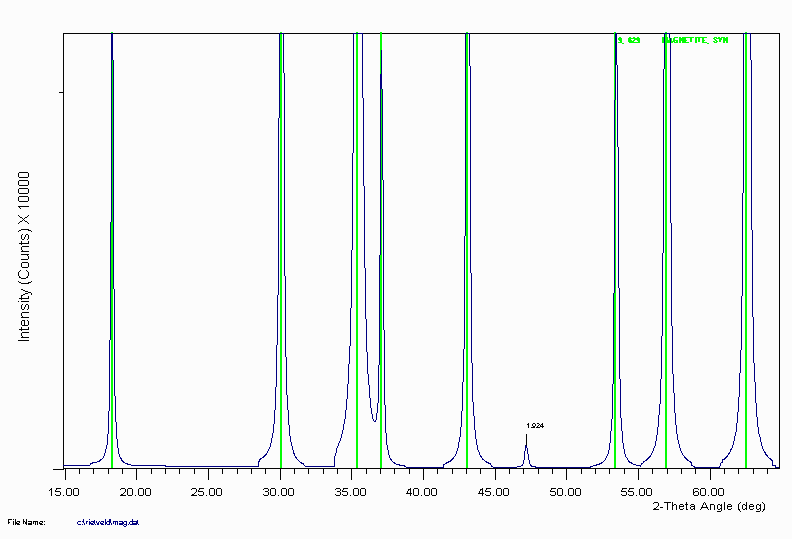
Magnetite is another example of ICDD reference data not including a trace peak at 1.92Å that would normally be assigned as either unknown, or to a different phase. The following pattern was generated by a Rietveld program.
Example 4c
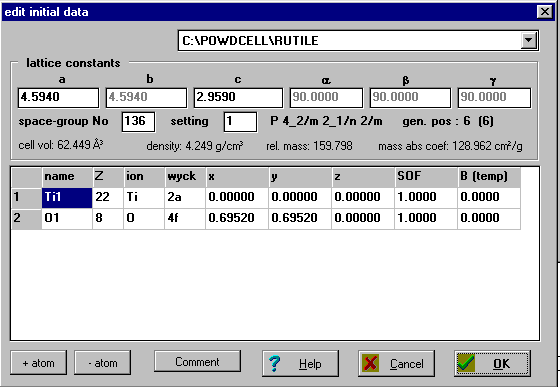
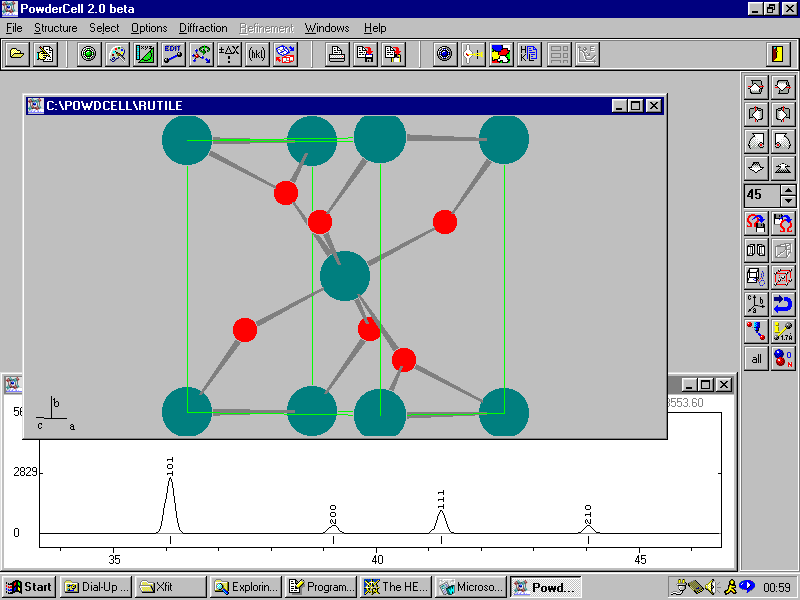
For those who do not like Rietveld programs, Powder Cell for Windows can be very useful, user-friendly program for calculation of powder patterns, and can read in ICSD structure files. The resulting calculated pattern can be exported into a variety of file formats.
Powder Cell Contact Gert Nolze - gert.nolze@bam.de
http://www.bam-berlin.de/a_v/v_1/powder/g_cell.html
http://www.ccp14.ac.uk/ccp/web-mirrors/powdcell/a_v/v_1/powder/e_cell.html
Example 5
This sample comes from a geothermal vent. There are some rather exotic minerals present. A qualitative XRF was taken on the sample to help confirm whether these assignments were reasonable.
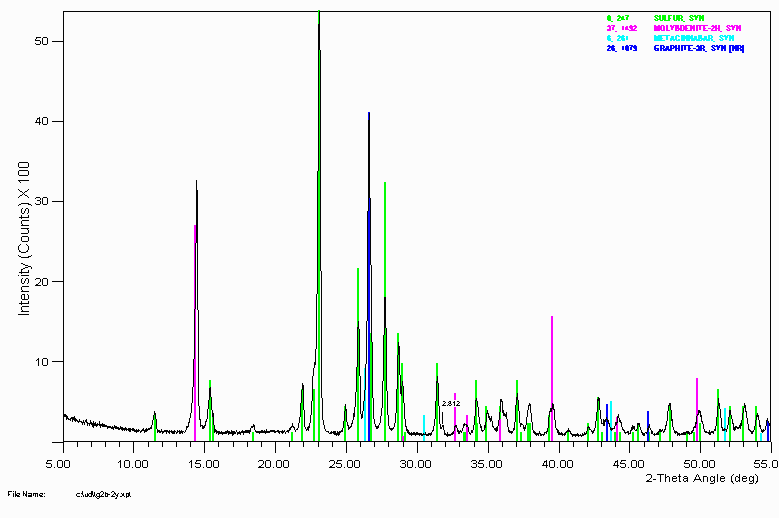
Also note that peak broadening implies smaller crystallite size than if they were sharp peaks. This could be due to the sample itself or the sample preparation. When working with a new phase system, testing out the effects of sample preparation can be quite important to check which methods might be destroying the crystallinity of the sample or causing phase changes.
Example 5
Qualitative XRF confirmed the presence of Sulfur, Molybdenum and Mercury.
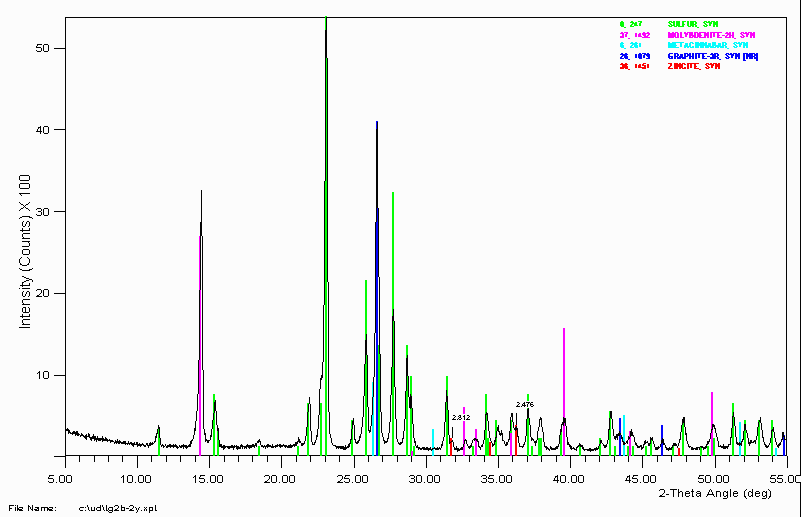
Qualitative XRF also showed the presence of Zinc. A "guess" was taken that zincite might be present in the sample. This not only matched well with the 2.812Å peak but also a 2.476Å shoulder that was ignored.
The ICDD/JCPDS PDF-2 CD-ROM could have been used inputting the single peak while searching for a Zinc phase. It didn't happen that way. Successful phase identification on unknown materials can seem quite impulsive and irrationally performed.
It should be noted that the identification of zincite in the sample was not all that important to this particular problem. On some occasions, you only have to identify enough of the phases present to answer the question being asked. When given a sample for phase identification, it does not hurt to ask why the sample needs a phase identification. This simple question could save you much unnecessary effort. Even to the point where you may decide XRD is not appropriate and another type of analysis is required (i.e, SEM, Micro-Probe, IR, Mass-Spec).
Note that even if the customer is happy with a partial result, this does not meant you have to be content with it. Completing the analysis to your satisfaction can gain you much experience that can be applied later.
Example 6
This is a sulphide ore sample with 12 matched phases.
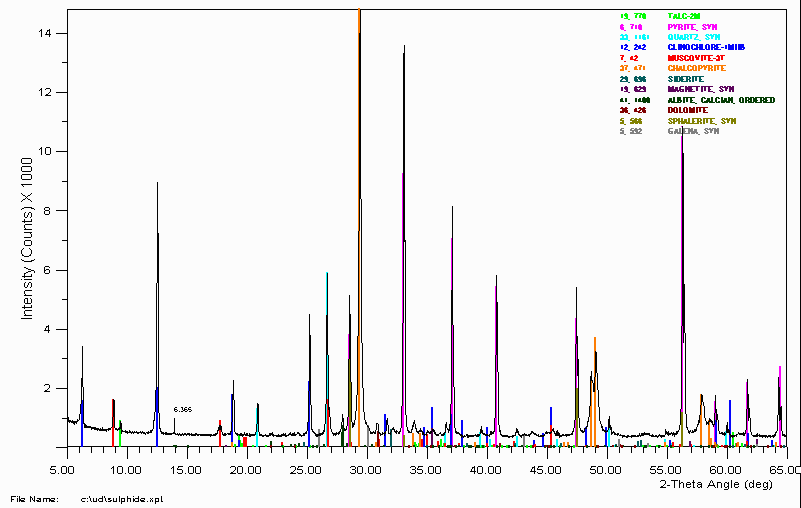
To get to this point, two different search match programs were used. The ICDD/JCPDS PDF-2 database on CD-ROM was used. Published studies on the original ore-body were referred to as well as consulting with an expert mineralogist and sulphide-ore processing scientist. SEM and Microprobe was also used. SEM and Microprobe showed that there were many more phases in the sample not visible by the XRD pattern including several forms of siderite and dolomite. This brought up the total number of phases in the sample to ~24 to 28 phases.
This took more than 5 minutes to get to this point and that was the easy part. An accurate quantitative Rietveld analysis was the main point of collecting XRD data on this sample.
Example 7
To the Ilmenite phase system.
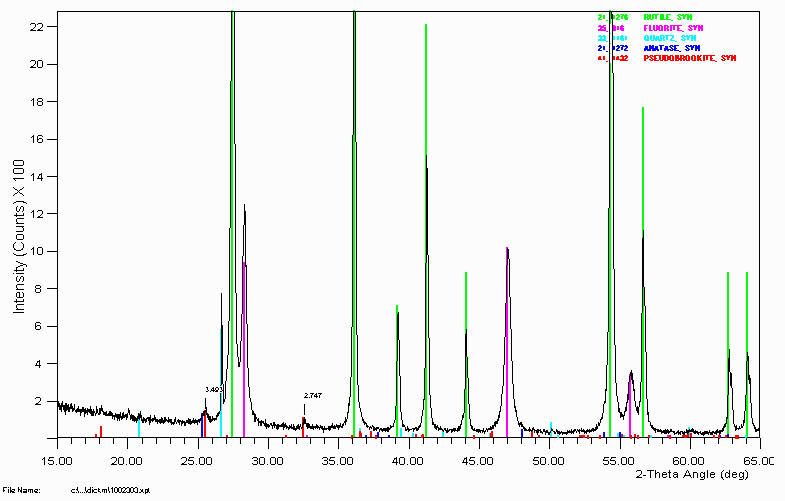
It is quite nifty how anatase can be assigned based on a single little hump that is almost swamped by the pseudobrookite. It helps having the input of the person who generated the sample and who also has 20 to 30 years experience in this area of ilmenite processing. Phase Identification can be quite frustrating and time consuming if just treated as a bureau service where samples are blindly dropped off. It can be much more time effective and fruitful if the people who generate the samples are involved in the analysis. Modern user-friendly Search-match software makes this easy to achieve and many users can be analysing their own samples with this modern software with the minimum of hassle.
R. R. Merritt and L. M. D. Cranswick, Proceedings of the 6th AusIMM Extractive Metallurgy Conference, Brisbane, 3 -6 July, 1994, pp 171-180
Example 7
To the bauxite phase system.
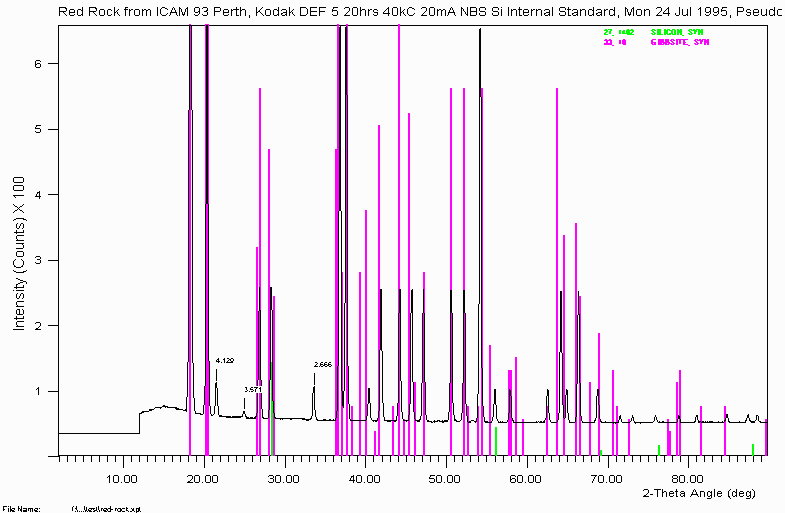
The sample for the above scan is a tiny flake (pin point size) of sample shown to be Gibbsite. Note that silicon was added as a position standard. This was using an X-ray camera called a Gandolfi camera. It helps to be informed of what other equipment is available round the place and what their capabilities are. In this case, the Gandolfi camera was in the laboratory next door being near ignored and gathering dust.
Other people might note that a ~$350,000 "scanning Microdiffractometer" could do a nicer job on micro-samples for phase identification. You are often limited to the equipment you have access to and have to try and do the best you can.
Note how some peaks remain un-identified. There are only so many hours in the day and when swamped with samples and juggling analytical jobs, it can be difficult to complete everything to 100%. Some things fall down the cracks. Phase Identification can take time. Though one strategy can be to leave a problem alone for a while and come back to it from a fresh perspective. Discussing it with colleagues can also help to generate alternative ideas (refer Example 11).
Example 8
Another bauxite sample.
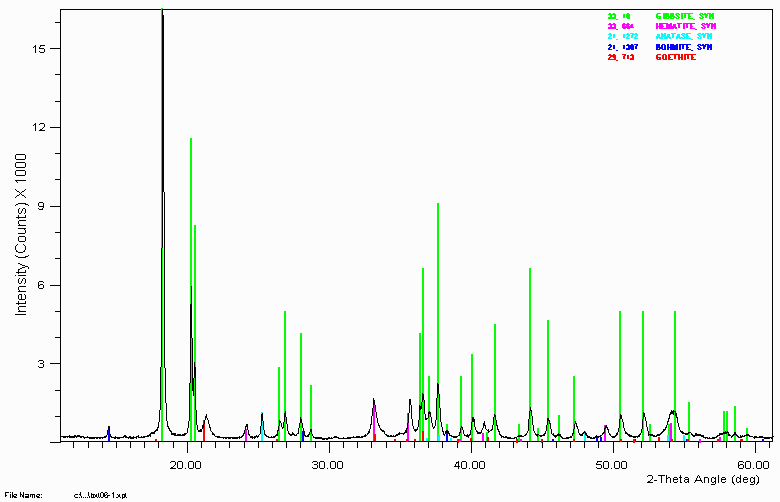
Having access to people and information on typical bauxite type phases made it relatively trivial to identify all significant phases including the 3 minor/trace phases, anatase, bohmite and goethite. Without this available expertise, identification of these phases could have been very time consuming and performed with much less confidence.
Example 8
Bauxite sample close up showing peaks implying extra gangue material.
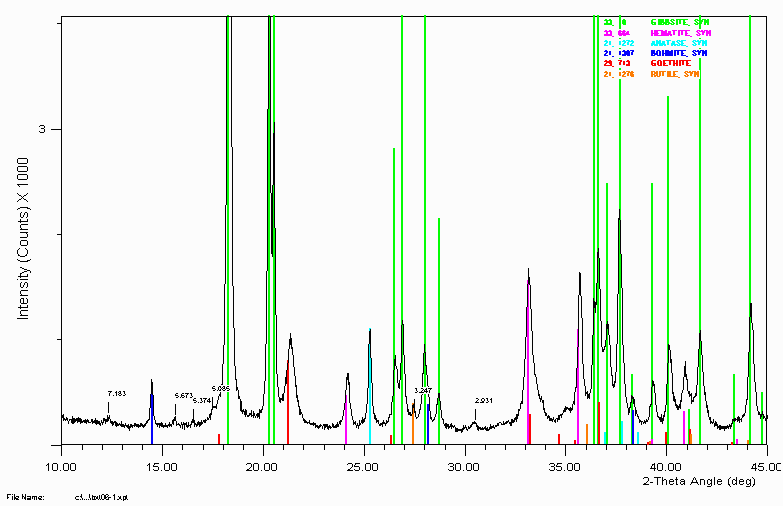
The 5.085Å labelled peak is most likely/could be the gibbsite satellite peak due to tungsten (1.47Å X-rays). The 5.374Å labelled peak is most likely/could be the gibbsite satellite peak due to Cu K beta (1.37Å X-rays).
The 3.247Å peak could be rutile.
Generally, I have been in the habit of using the amount of tungsten leaking into the detector as an indication of when an ageing XRD tube should be turfed. This was in a laboratory where trace phase identification was very important. When Tungsten peaks start interfering too much, it was time to turf (throw away) the XRD tube.
Note the peak shift of the goethite. This could imply the goethite has some substitution in it. Possibly aluminium. A combination of SEM, microprobe and
Vegards law could quantify the amount of substitution if this was found to be the case.
Note the trace phase at 2.931Å. This remained unidentified until two bauxite specialists in the audience of a March 1999 talk at CSIRO in Perth, Australia. It never hurts to keep alive old samples that were not 100% solved. Refer example 11 below for the goss (gossip - a.k.a. story) on what and "why" this peak/phase is there. Also, other mysteries are possibly solved!
Example 10 (Warning, following is rather contrived)
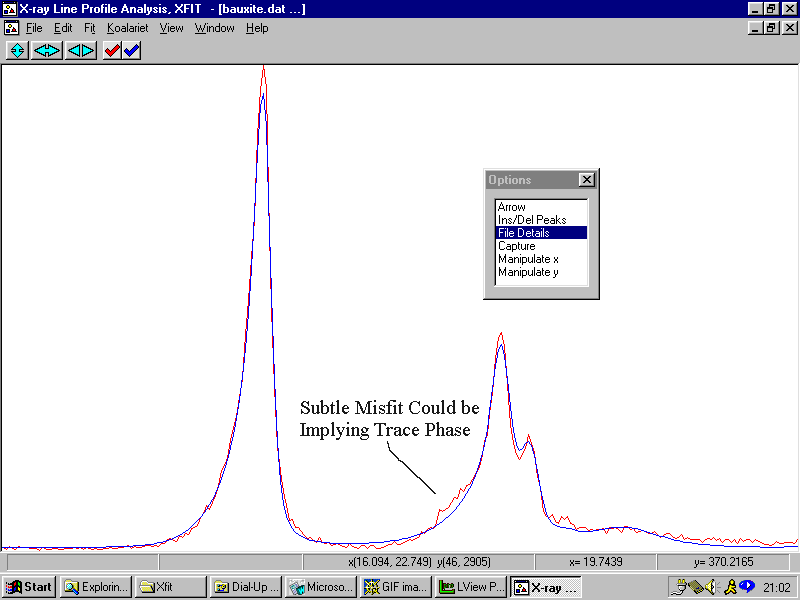
A Bauxite sample - but this time we try to use difference peaks in a Rietveld Quantitative analysis to try and determine trace phases. The following is more a contrived example of what can be possible when using Rietveld to identify trace unassigned peaks in the Rietveld difference plot.
A good option for software in the future would be to interlink phase identification to quantitative/profile-fitting/Rietveld analysis software.
Example 11
A Bauxite sample from Example 8 with some trace peaks unassigned. They trace peaks were not considered important at the time.
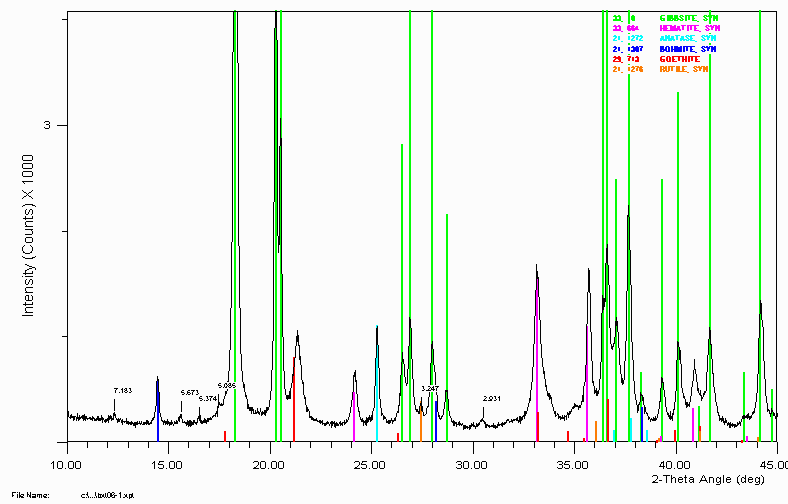
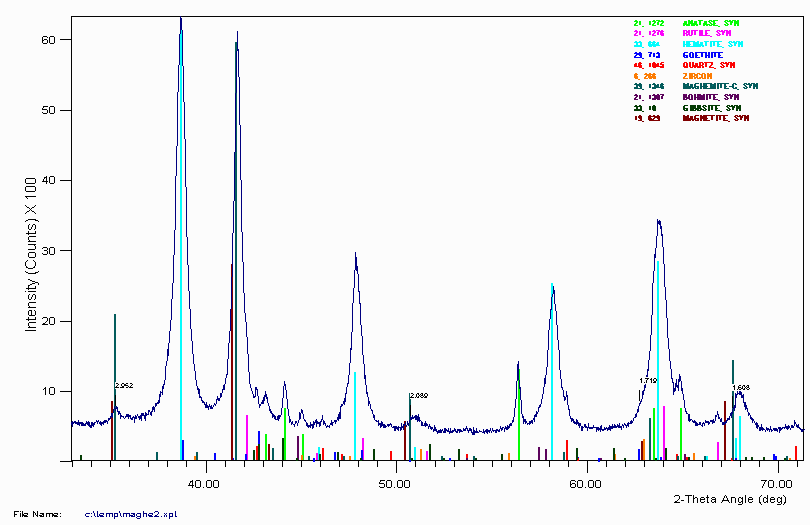
During Version 4 of this talk, some Bauxite people in the audience suggested the 2.931Å peak is most likely Maghemite (Iron Oxide). Without any prior knowledge of the sample, this could imply this is an Australian bauxite and the sample was taken near the top of the ore body. Normally Maghemite (Iron Oxide) would not be expected or favoured to form but the theory behind its formation (and this sample being of surface origin) is that it is the inadvertant result of ~40,000 years of human environmental engineering. Regular and deliberate burning of forest and bushland was a common practise amongst many Australian Aboriginal groups. The combination of the high heat of burning and availability of carbon/charcoal can favour the formation of maghemite in the surface layers of the soil. It is possible that continual burning every few years or so could form up quite a layer of Maghemite on the surface of an ore deposite. (This is presently a theory of which some subscribe to, and others disagree with.)
The 7.183Å peak is most likely Kaolinite
Example 11a
While these single peak assignments may seem dodgy to anyone not familiar with bauxites, they seem obvious to people who already have dealt with these Australian bauxites.
As a check, prior to placing this on the web, the above was queried on the Clay Minerals Mailing List to check out information on Maghemite and bauxites.
Thanks to Ken Towe (E-mail: towe@accucomm.net), the following "old trusty" reference by "Brown, 1961" was recommended as well as querying if the above peak position could actually be better described as Magnetite which does have a peak at 3.63Å. Where as Maghemite as the main peak at 3.65Å.
I don't see that maghemite has a reflection at 2.931. It does have one
at 2.95, I = 30, hkl (220), but this is not the strongest peak. The strongest
is 2.514, I = 100, hkl (313). Maghemite is difficult to distinguish from
magnetite anyhow. Is it magnetic?
While the above sample may thus be a decision between maghemite or magnetite, the following related sample from an Australian mine site implies maghemite. (The above dataset is on a backup CD-ROM in Melbourne and presently unavailable)
Brown's "X-Ray Identification and Crystal Structures of Clay Minerals" (1961 edition, Mineralogical Soc., London), states under the "Nature of Laterites and Bauxites",
"Laterite is a general term used to describe naturally occurring mixtures consisting essentially of hydrated oxides of aluminium, iron and titanium, but often containing a considerable amount of clay minerals such as kaolinite or halloysite."
......
"Bauxites containing gibbsite, boehmite, or diaspore or a mixture of gibbsite and boehmite are known. in the ferruginous laterites the iron is usually found as hematite, and, sometimes, in highly ferruginous varieties, maghemite is present. A summary of the results of X-ray examinations of bauxites and laterites from various sources is given in Table X.4 (pp. 380-381)"
D.M.Moore (E-mail: moore@isgs.uiuc.edu) also replied:
"You might look at a chapter in Dixon, J.B., and Weed, S.B., eds, Minerals in the Soil Environment, 2nd Ed, a chapter by Schwertmann and Taylor, Iron Oxides. They, and several other contributors, state that maghemite is an oxidation product of magnetite and common in tropical and semi-tropical soils. It has even been found in soils of cool climates. Althougth the strongest peaks are close to those of magnetite, they are almost always broader."
The Benefits of Experience or Interacting with Experience People
While some of the above interpretations may seem to be drawing a lot of conclusions from one single trace peak assigned by some people in the audience; speedy, qualitative, expert interpretation of XRD patterns can result in a lot of very useful information very quickly.
For instance, identifying the presence of trace Cristobalite (SiO2) may signal a completed phase Identification to the X-ray analyst. To an expert it may be signalling the the furnace reactor is grossly out of calibration.
In some fields, it is not uncommon for the expert scientist to be able to identify all phases purely by looking at the pattern; and also glean information about occurances inside the process plant (temperature, pressure, Oxygen fugacity, etc) by not only identifying what phases are present but noting relative peak displacments, and relative intensity ratios.
Thus interacting with the local experts who are either generating the samples or have the expertise to assist you in an interpretation are a major asset you should be trying to interact with.
Directly interacting with the people (at all levels) who generated the samples can greatly help achieve a "useful" quality Phase Identification result.
Available Search-Match Software
(Taken from: http://www.ccp14.ac.uk/solution/search-match.htm)
Note: Unless otherwise stated, all the software below is either Shareware or Commercial software (i.e, present freeware of Macdiff and Powder Suite/Portable Logic software). All these programs, unless stated, use the ICDD Database (http://www.icdd.com).
Alan Mighell (NIST, USA) algorithm that can search on HKLs for looking into high pressure, high temp, solid solution problems. The ICDD distributes copies free.
"AXES" for DOS - (ftp://ftp.physic.ut.ee/pub/pc/axes/)
Brian Toby, NIST, "Powder Suite" for VMS - (ftp://credit.nist.gov/powdersuite/)
Brian Toby, NIST, "Portable LOGIC program" (freeware) written in Tcl/Tk for UNIX and Win95 - (http://rrdjazz.nist.gov/~toby/logic.html)
Bruker "DIFFRACplus" for Windows - (http://www.bruker-axs.com/Products/diffrac.html)
Diffraction Technology "Traces" for Windows - (http://www.ozemail.com.au/~difftech/products/traces.htm)
"DRXWin" for MS-Windows - (http://icmuv.uv.es/drxwin/)
Radicon "LookPDF" for Windows - (http://www.radicon.xraysite.com/)
MacDiff for Mac ("MacDiff is freeware and is available to everyone free of charge"). - (http://www.geol.uni-erlangen.de/macsoftware/macdiff/MacDiff.html)
MacPDF for Mac - (http://world.std.com/~crose/MacPDFWebSite/MacPDF_V3.html)
MDI "Jade" for Windows - (http://www.materialsdata.com/products.htm)
MicroPDSM - ?????
"Crystallographica Search-Match" for Windows - (http://www.crystallographica.co.uk)
Philips Search-Match Software for MS-Windows - (http://www-eu.analytical.philips.com/products/xrd/)
Socabim(?) - ????
Siefert "RayfleX" Software for MS-Windows - (http://www.roentgenseifert.com/seif4.9.htm)
Mark Raven - CSIRO, "XPLOT" for Windows - (http://www.clw.csiro.au/services/mineral/xplot.htm)
"XPowder" for Windows - (http://www.ugr.es/~jdmartin/)
"ZDS" for DOS and Windows - (http://krystal.karlov.mff.cuni.cz/xray/zds/zdscore.htm)
Book References on Phase Identification using Powder X-ray Diffraction.
(Using keywords of "X-ray Identification" at http://copac.ac.uk/copac/)
Brindley, G. W (George William), "The x-ray identification and crystal structures of clay minerals", 2nd ed / edited by G. Brown, Mineralogical Society, 1961
Mineralogical Society. Clay Minerals Group, "X-ray identification and crystal structures of clay minerals / edited by G.W. Brindley ; with contributions by W.F. Bradley ... [et al.]", London : Mineralogical Society, 1951.
"The X-ray identification and crystal structures of clay minerals / edited by G. Brown", London : Mineralogical Society, Clay Minerals Group, 1961
"The X-Ray identification and crystal structures of clay minerals / edited by G. Brown", [2nd ed], London : Mineralogical Society(Clay Minerals Group), 1972
Carroll, Dorothy, "Clay minerals : a guide to their X-ray identification",
Special paper / Geological Society of America ; 126, Geological Society of America, [1970], ISBN/ISSN: 0813721261.
"Crystal structures of clay minerals and their X-ray identification / edited by G.W. Brindley and G. Brown", Mineralogical Society monograph ; no.5, London (41 Queen's Gate, SW7 5HR) : Mineralogical Society, 1980, ISBN/ISSN: 0903056089
Moore, Duane M, "X-ray diffraction and the identification and analysis of clay minerals / Duane M. Moore, Robert C. Reynolds, Jr.", 2nd ed, Oxford, 1997: Oxford University Press, 1997, ISBN/ISSN: 0195087135
Moore, Duane M, "X-ray diffraction and the identification and analysis of clay minerals / Duane M. Moore, Robert C. Reynolds, Jr.", Oxford, 1989: Oxford University Press, 1997, ISBN/ISSN: 019505170X
Summary
When taken as a type of mystery requiring "detective-like" skills (trusting nothing - diffractometer, sample, reference database, software, etc), phase identification using Powder X-ray Diffraction can be a challenging and fun exercise.
But as in Detective Work, experience, discussion with the "suspects" who generated the sample and/or Interacting with Experienced People Counts.
Also, knowing where the pitfalls and problems are can save you much time and frustration. but once you know where the pitfalls are (it can be unfortunate when you don't know what you don't know), it is easier to achieve reliable results.