 MAD Phasing
  MAD Phasing
 Anomalous X-ray Dispersion
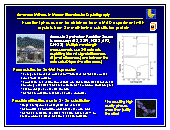
In the vicinity of the X-ray absorption edge(s) of an element the wavelength dependent contributions f' and f" to the atomic X-ray scattering factor change rapidly with wavelength. This effect can be exploited to obtain exceptional initial phases for a structure. Click on the icon above for a mini synopsis.
![]() Atomic
scattering factors (basic)
Atomic
scattering factors (basic)
![]() Anomalous
X-ray scattering (Introduction, Ethan Merritt's site)
Anomalous
X-ray scattering (Introduction, Ethan Merritt's site)
![]() Table of absorption edges and eV <> wavelength conversion
Table of absorption edges and eV <> wavelength conversion
![]() Graph of absorption edges
Graph of absorption edges
![]() Look at MAD maps (very pretty)
Look at MAD maps (very pretty)
Estimating the anomalous scattering signal
The changes in the intensities caused by the anomalous scattering are very small. Differences of a few percent can be observed between |F(hkl)| and its Friedel opposite |F(-hkl)| at the same wavelength (Bijvoet differences) and the same |F(hkl)| at different wavelengths (Dispersive differences). The question arises how to estimate these anomalous effects, and how accurately do we need to measure the data to distinguish between actual dispersive signal and just noise in the data?
We have a little program on this site that allows to estimate the anomalous signal ratios for a given protein based on the number and kind of anomalous scatterers, the number of residues, and the theoretical values for the anomalous scattering factors f' and f" [1-4]. The anomalous scatterer is entered by element symbol. Ratios for 5 wavelengths are used, the (optional) first one entered as an x-ray anode element (in some cases even in-house data can deliver useful anomalous data) and the other 4 in reference to the absorption edge. The format of the output follows closely Wayne's MADSYS: The diagonal elements of the output matrix contain the Bijvoet ratios, and the off-diagonal elements the dispersive ratios between different wavelengths. To obtain a usable anomalous signal, the data must be measured with a significantly better (lower) noise level, which can be determined by deriving the Bijvoet ratios from measured centric reflections (centric reflections do not contain any Bijvoet differences, and the merging statistics for centrics thus reveal the statistical noise in the data).
Like all other rules of thumb ('at least one Se for 17 kD'), favourable estimates do not guarantee a good result. Wavelengths may be difficult to optimize for best dispersive ratios; on the other hand, if you have a white line, the values for f" may be higher. The success of MAD phasing critically depends on data quality and completeness, and special collection techniques for Friedel opposites (inverse beam) etc. are advantageous. Additional problems can arise from, for example, space group related difficulties in solving the anomalous difference maps by Patterson or direct Methods. For a quick review about MAD phasing see refs. [5,6].
References
[1] Cromer and Liberman, J. Chem. Phys. 53,1891-1898 (1970)
[2] Cromer and Liberman, Acta Cryst. A37, 267-268 (1981)
[3] Kissel & Pratt, Acta Cryst. A46, 170-175 (1990)
[4] Don.T.Cromer, Program FPRIME
[5] E.Fanchon and W.A. Hendrickson, in Crystallographic Computing, Volume 5, Chapter 15,
IUCr/Oxford University Press (1991)
[6] H.M.Krishna Murthy, in Crystallographic Methods and Protocols, Chapter 5, Humana Press
(1996)
![]() Back to X-ray Facility Introduction
Back to X-ray Facility Introduction
LLNL Disclaimer
This World Wide Web site conceived and maintained by
Bernhard Rupp (br@llnl.gov)
Last revised November 02, 1999 16:59
UCRL-MI-125269