 Tetanus Toxin C FragmentTetanus Toxin C Fragment
Mark Knapp, Brent Segelke, Sean Parkin, and Bernhard Rupp (LLNL-BBRP)
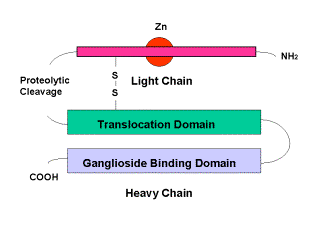
The illness known as Tetanus is caused by a neurotoxin produced by the anaerobic bacterium Clostridium Tetani. It acts upon the presynaptic membranes of both central and peripheral nervous systems to block the release of neurotransmitters In its toxic form tetanus is a 150 kDa protein, consisting of two major components: these are the light chain, which contains the enzymatic portion of the toxin and is responsible for its toxic effects, and the heavy chain which binds to the neuron and aids delivery of the light chain to the neuron interior. These are linked by a single disulphide bond. Fragment C (TTFC) is that portion of the heavy chain that actually binds to gangliosides of the cell membrane.
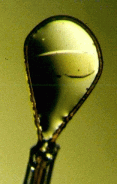
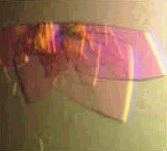
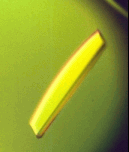
Mark Knapp has successfully crystallized this protein and we collected data on the native and 3 heavy atom derivatives. MAD data on the Au derivative have been collected on the SSRL beamline 1-5 with the help of Henry Bellamy. Here the progress from spherules to diffraction quality platelets and the final crystals by the power of streak seeding and serial dilution! The icon on top shows a TTFC crystal mounted in a cryo-loop.
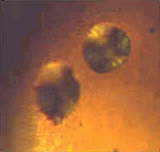
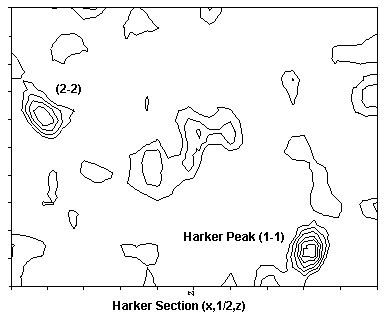
Three isomorphous heavy metal derivatives with good phasing power have been found. The initial Patterson maps have been solved by hand (BR), correlation search (BR) and by Patterson superposition and Direct Methods (SHELXS, SP). Subsequent derivatives were solved from cross-difference Fourier maps. Here one of the the beautiful Patterson maps :
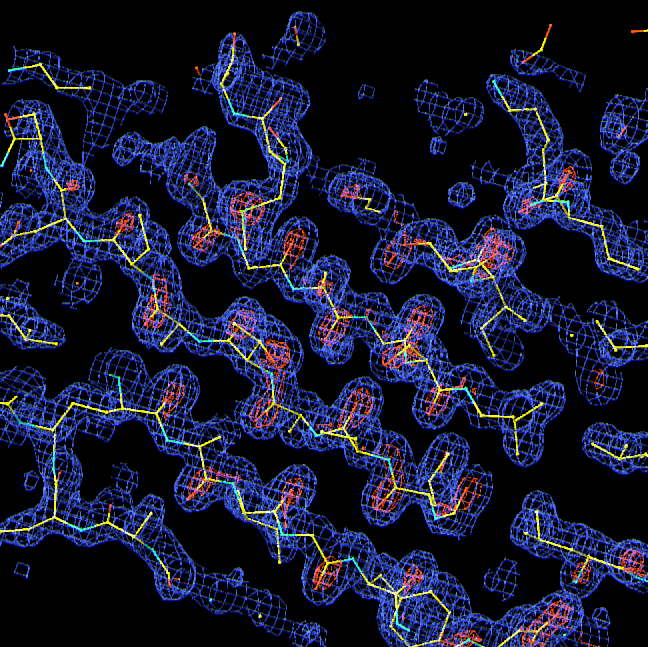
The structure has been finally solved with the program SOLVE from Tom Terwilliger by combining MIR and Au MAD phases. The exceptional experimental phases to 1.7 A allowed unambiguous tracing on the model. It is very uncommon to have such fantastic experimental phases from a large protein (450 residues).
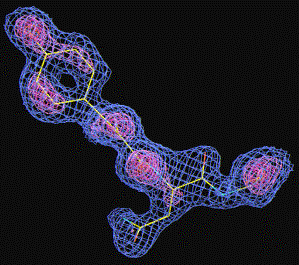
Notice that this is a purely experimental e-density WITHOUT any phase combination with the model - the tyrosine is just placed into the original density !
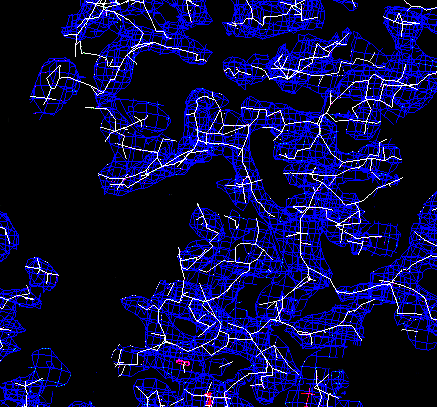
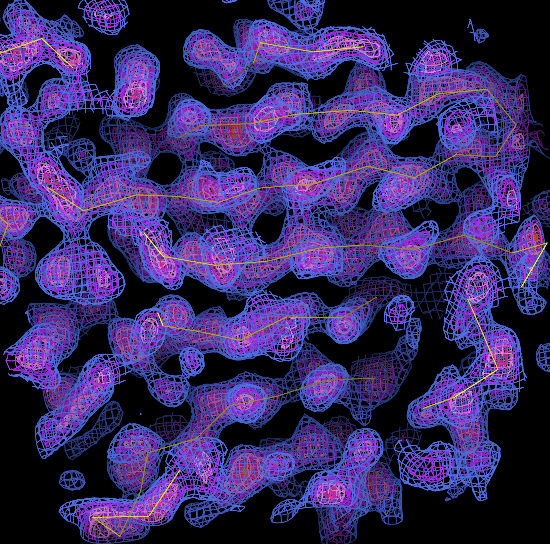
You can compare the initial MIR map and the SIRAS map by SOLVE with the combined MIR and MAD map shown below:
Paper and PDB file are in preparation!
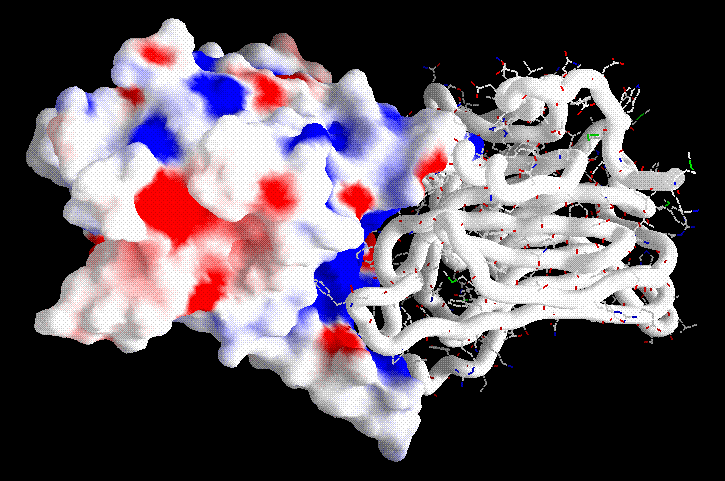
Charge distribution by GRASP in the C-terminal domain of the TTFC fragment. The red (negatively charged) pocket next to the cleft and the in the center of the domain contains the putative binding site.
![]() Back to X-ray Facility Introduction
Back to X-ray Facility Introduction
LLNL Disclaimer
This World Wide Web site conceived and maintained by
Bernhard Rupp (br@llnl.gov)
Last revised October 15, 1999 18:26
UCRL-MI-125269